
 Travel Essentials
 Travel Essentials

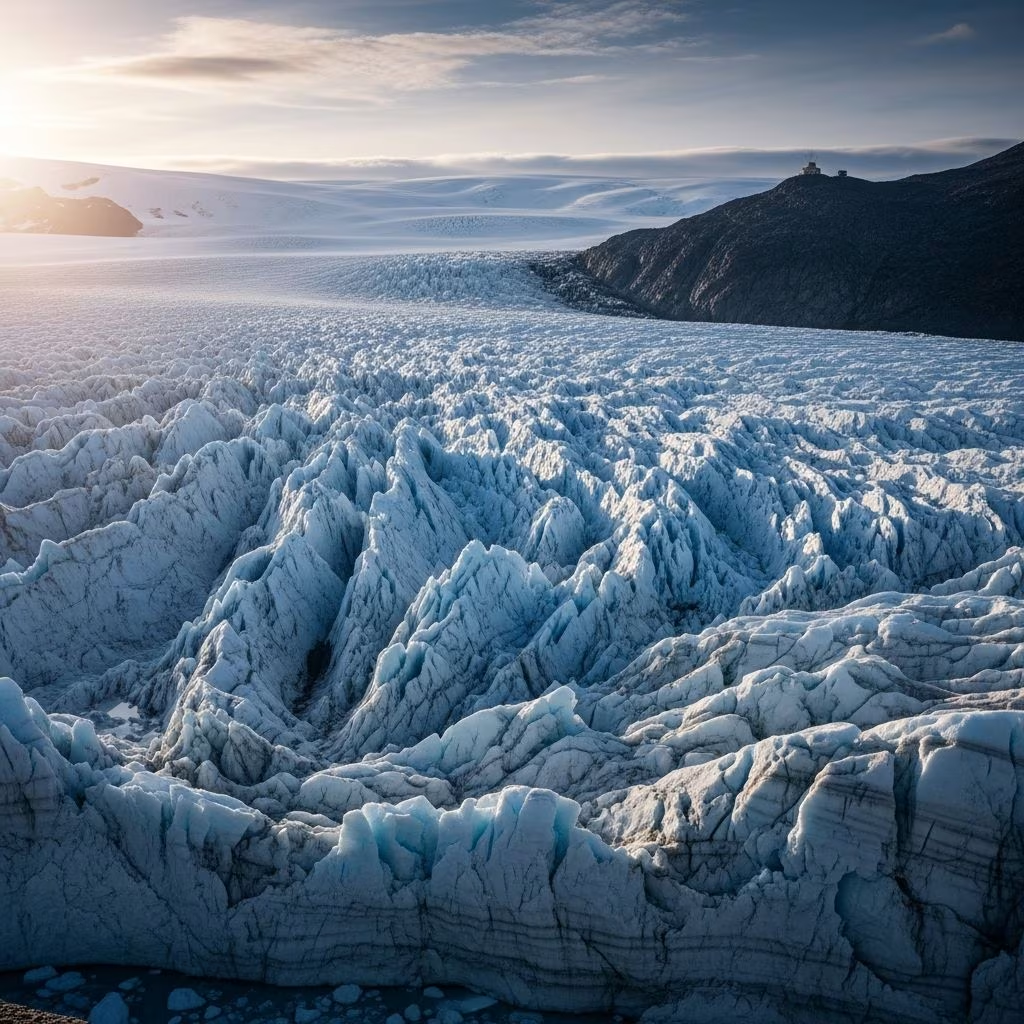
NASA’s 48-year satellite record shows glaciers retreating, accelerating sea level rise, and revealing long-term climate trends worldwide.
 Travel Essentials
Over nearly five decades, satellites have silently observed the Earth’s frozen frontiers, capturing the subtle shifts and dramatic retreats of glaciers worldwide. NASA’s innovative time-lapse visualizations, drawn from Landsat imagery spanning 1972 to 2019, offer an unprecedented view of how warming temperatures are reshaping ice landscapes in Alaska, Greenland, and Antarctica. These animations not only highlight individual glacier behaviors but also reveal broader patterns of ice loss that contribute to rising seas and altered ecosystems.
Satellite technology has revolutionized glaciology by providing consistent, global coverage impossible from ground-based efforts. The Landsat program, a joint NASA-USGS initiative, has delivered free, high-resolution images every 16 days since 1972, enabling researchers to compile detailed records of ice movement, retreat, and mass balance. Glaciologist Mark Fahnestock at the University of Alaska Fairbanks pioneered these time-lapses, stitching together mosaics to visualize every glacier in Alaska and the Yukon over 48 years.
This longitudinal approach distinguishes short-term fluctuations—like seasonal surges—from enduring climate signals. As Fahnestock notes, such extended records allow scientists to “discern long-term trends and separate them from the kind of behavior you might get with a couple warm or a couple of cold years”. Similar analyses extend to Greenland’s outlet glaciers and Antarctica’s ice shelves, painting a cohesive picture of planetary ice decline.
Alaska hosts over 100,000 glaciers, making it a critical laboratory for studying ice dynamics in a warming world. Time-lapse videos reveal stark transformations: the Columbia Glacier, stable in 1972, began retreating in the mid-1980s and by 2019 had pulled back 12.4 miles (20 km), calving massive icebergs into Prince William Sound. In contrast, the Hubbard Glacier advanced 3 miles (5 km) over the same period but showed a concerning 2019 calving embayment—the first sign of vulnerability in decades.
These visuals capture diverse behaviors: surging glaciers that pause and resume, proglacial lakes forming in retreat voids, and landslide debris racing to the sea. Such patterns hint at underlying drivers, from bedrock topography to ocean warming. Fahnestock’s mosaics track surface lowering as glaciers accelerate, thickening in some upland areas, offering clues to mass redistribution.
| Glacier | Change (1972-2019) | Key Observation |
|---|---|---|
| Columbia Glacier | 12.4 miles (20 km) retreat | Rapid calving post-1980s |
| Hubbard Glacier | 3 miles (5 km) advance | 2019 embayment signals potential shift |
| General Alaskan Trends | Accelerated flow speeds | Surface lowering, lake formation |
Greenland’s ice sheet, holding enough water to raise global seas 23 feet (7 meters), loses mass primarily through its ~200 large outlet glaciers. Analysis of Landsat data from 1985-2018 shows these fronts retreated an average 3 miles (5 km), with peak retreat between 2000-2005. Ice flux to the ocean remained steady until ~2000, then surged, linking directly to front positions.
Michalea King of Ohio State University quantified this: retreating fronts correlate with heightened calving, amplifying discharge. Meanwhile, James Lea of the University of Liverpool maps supraglacial meltwater lakes, whose expansion accelerates surface melting and hydrofracturing—cracks that propagate to the bed, hastening flow. Recent studies highlight steep bedrock knickpoints that temporarily buffer inland thinning by stabilizing flow.
Antarctica’s transformations are equally alarming. A comprehensive study using 40 years of data—from NASA’s Operation IceBridge, satellite radar, and Landsat—reveals ice mass loss jumped sixfold from 1979-2017. Early losses averaged 40 gigatons/year (1979-1990); by 2009-2017, it hit 252 gigatons/year—a 280% decadal increase post-2001.
Eric Rignot of UC Irvine, leading the research, warns this melting has already contributed over half an inch to sea level rise, with multi-meter rises projected centuries ahead. The assessment covered 18 regions, 176 basins, and islands, confirming broad deterioration. West Antarctica drives much of the acceleration, vulnerable to warm ocean currents.
Glacier melt from these regions is a primary sea level driver. Alaska’s contributions, though smaller volumetrically, impact local coasts profoundly. Greenland’s output could add feet to oceans this century, while Antarctica holds century-scale potential for multi-meter rise. Combined, these losses exacerbate coastal flooding, saltwater intrusion, and ecosystem shifts.
Beyond seas, retreating ice alters freshwater inputs, ocean circulation, and albedo—Earth’s reflectivity—accelerating warming. Time-lapses underscore urgency: persistent trends outpace natural variability, demanding emission cuts.
Landsat’s endurance stems from multiple satellites ensuring unbroken coverage. Complementary tools like IceBridge’s aerial surveys and radar interferometry refine mass balance estimates. Machine learning now automates feature tracking in vast datasets, scaling analyses globally.
Future missions, including Landsat Next (launching 2030s), promise daily revisits at higher resolutions, enhancing predictions. Integrating with GRACE gravimetry tracks total mass changes, validating time-lapse insights.
Interpreting satellite data demands accounting for surges, tides, and basal hydrology. Cloud cover hampers optical imagery, necessitating radar fusion. Modeling bed topography remains tricky, as seen in Greenland’s knickpoints. Yet, 48-year baselines empower robust trend isolation.
Time-lapses span 1972-2019 (48 years) for Alaska, 1985-2018 for Greenland glaciers.
12.4 miles (20 km) since the mid-1980s.
Yes, sixfold from 40 Gt/yr (1979-1990) to 252 Gt/yr (2009-2017).
Recent embayments suggest potential retreat, mirroring Columbia’s precursor.
They reveal long-term trends beyond short-term weather noise.
These findings bolster IPCC assessments, urging rapid decarbonization. Coastal nations must adapt via resilient infrastructure; international pacts like Paris Agreement gain data-driven urgency. Public engagement—via accessible NASA videos—fosters climate literacy.
Continued monitoring is vital; sustaining Landsat ensures ongoing vigilance against ice’s silent alarm.