
 Travel Essentials
 Travel Essentials

Explore the top turbulent flight routes worldwide and in North America, based on eddy dissipation rate data. Tips for nervous flyers and safety insights included.
 Travel Essentials
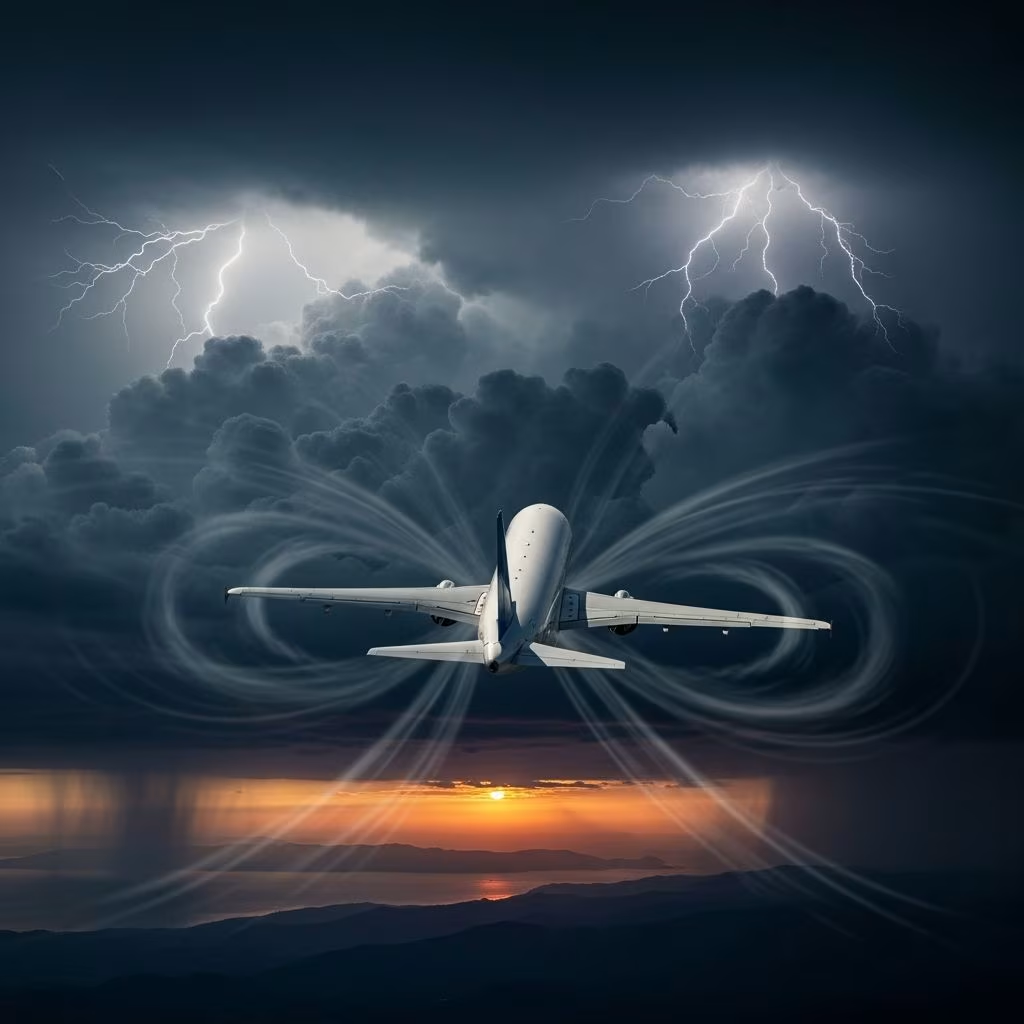
Air travel offers unparalleled convenience, but turbulence remains one of the most common sources of anxiety for passengers. Certain routes consistently encounter more rough air than others due to geographical features, weather patterns, and atmospheric dynamics. This article ranks the most turbulent flight paths globally and regionally, drawing on turbulence metrics like the eddy dissipation rate (EDR), a standard measure of turbulence intensity used by aviation experts. Understanding these patterns helps travelers prepare and choose flights wisely.
Turbulence occurs when air currents create sudden changes in aircraft motion, ranging from light chop to severe jolts. The EDR quantifies this by measuring how quickly air parcels mix, with values above 20 indicating moderate to severe conditions that may require seatbelt signs. Factors driving turbulence include:
Tools like Turbli aggregate forecasts from NOAA and the UK Met Office, analyzing thousands of routes to produce annual rankings based on average EDR. While no route guarantees bumps every flight, these paths show elevated risk year-round.
South American and Himalayan routes dominate the global leaderboard for 2024-2025, with short hops over mountains proving bumpier than long-haul flights. Here’s the ranking by average EDR:
| Rank | Route | Distance (km) | Avg. EDR |
|---|---|---|---|
| 1 | Mendoza (MDZ) – Santiago (SCL) | 196 | 24.684 |
| 2 | Córdoba (COR) – Santiago (SCL) | 660 | 20.214 |
| 3 | Mendoza (MDZ) – Salta (SLA) | 940 | 19.825 |
| 4 | Mendoza (MDZ) – San Carlos de Bariloche (BRC) | 946 | 19.252 |
| 5 | Kathmandu (KTM) – Lhasa (LXA) | 571 | 18.817 |
| 6 | Chengdu (CTU) – Lhasa (LXA) | 1265 | 18.644 |
| 7 | Santa Cruz (VVI) – Santiago (SCL) | 1905 | 18.598 |
| 8 | Kathmandu (KTM) – Paro (PBH) | 402 | 18.563 |
| 9 | Chengdu (CTU) – Xining (XNN) | 685 | 18.482 |
| 10 | San Carlos de Bariloche (BRC) – Santiago (SCL) | 861 | 18.475 |
The Mendoza-Santiago route tops lists for its perilous crossing of the Andes, where narrow valleys funnel fierce winds. Similarly, flights to Tibet navigate the world’s highest peaks, creating intense rotor clouds.
U.S. routes, particularly in the Mountain West, feature prominently due to the Rockies’ influence. No North American path cracks the global top 10, but locally they pack a punch:
| Rank | Route | Distance (km) | Avg. EDR |
|---|---|---|---|
| 1 | Albuquerque (ABQ) – Denver (DEN) | 561 | 17.751 |
| 2 | Denver (DEN) – Jackson Hole (JAC) | 653 | 17.454 |
| 3 | Jackson Hole (JAC) – Salt Lake City (SLC) | 329 | 17.419 |
| 4 | Denver (DEN) – Salt Lake City (SLC) | 629 | 16.948 |
| 5 | Bozeman (BZN) – Denver (DEN) | 843 | 16.688 |
| 6 | Ontario (ONT) – San Diego (SAN) | 150 | 16.439 |
| 7 | Boise (BOI) – Salt Lake City (SLC) | 466 | 16.305 |
| 8 | Bozeman (BZN) – Salt Lake City (SLC) | ~600 | 16.252 |
| 9 | Las Vegas (LAS) – Reno (RNO) | ~700 | 16.068 |
| 10 | Las Vegas (LAS) – Salt Lake City (SLC) | ~600 | 15.875 |
Denver hubs amplify exposure, as flights to Jackson Hole weave through Teton peaks, notorious for mountain wave turbulence.
Andean Dominance: Chile-Argentina paths like MDZ-SCL face katabatic winds—cold air rushing downhill from glaciers—interacting with trade winds for explosive shear.
Himalayan Challenges: Routes to Lhasa or Paro climb over 4,000-meter passes, where lee waves persist even in clear skies. Pilots often request altitude deviations, but options are limited.
Rocky Mountain Effects: U.S. Southwest flights encounter thermal turbulence from desert heating and orographic lift over ranges. Winter jet stream dips intensify matters near DEN and SLC.
Other notables include transatlantic jumps like New York-London, battered by North Atlantic Track jet streams, and Pacific crossings over Japan prone to typhoon remnants.
Modern aviation minimizes risks through advanced forecasting. Pilots access real-time data from apps like Turbli, adjusting altitudes by thousands of feet to skirt clear air turbulence (CAT). Cabin crew enforce seatbelts during forecasts, reducing injury rates to near zero—statistically safer than driving.
Nervous flyers can strategize:
For families, explain turbulence as “air pockets” akin to road bumps to ease kids’ fears.
Mountain waves and jet stream shear top the list, especially over the Andes and Rockies.
Rarely; injuries stem from unbelted movement, not airframe stress. Always buckle up.
LATAM, Sky Airline for Andes; United, Delta for U.S. mountains; Bhutan Airlines for Paro.
Not guaranteed, but data-driven choices reduce odds significantly.
Climate change may increase CAT by 10-40% by 2050-2080, per studies.
Knowledge empowers confident flying. While Mendoza-Santiago claims the bumpiest crown, every route has serene days. Airlines’ vigilance ensures turbulence is more inconvenience than threat. Plan with data, stay belted, and enjoy the journey above the fray.