
 Travel Essentials
 Travel Essentials

San Diego International Airport ranks as the costliest for domestic flights in the US at $373.79 average. Explore causes, comparisons, and tips amid major expansions.
 Travel Essentials
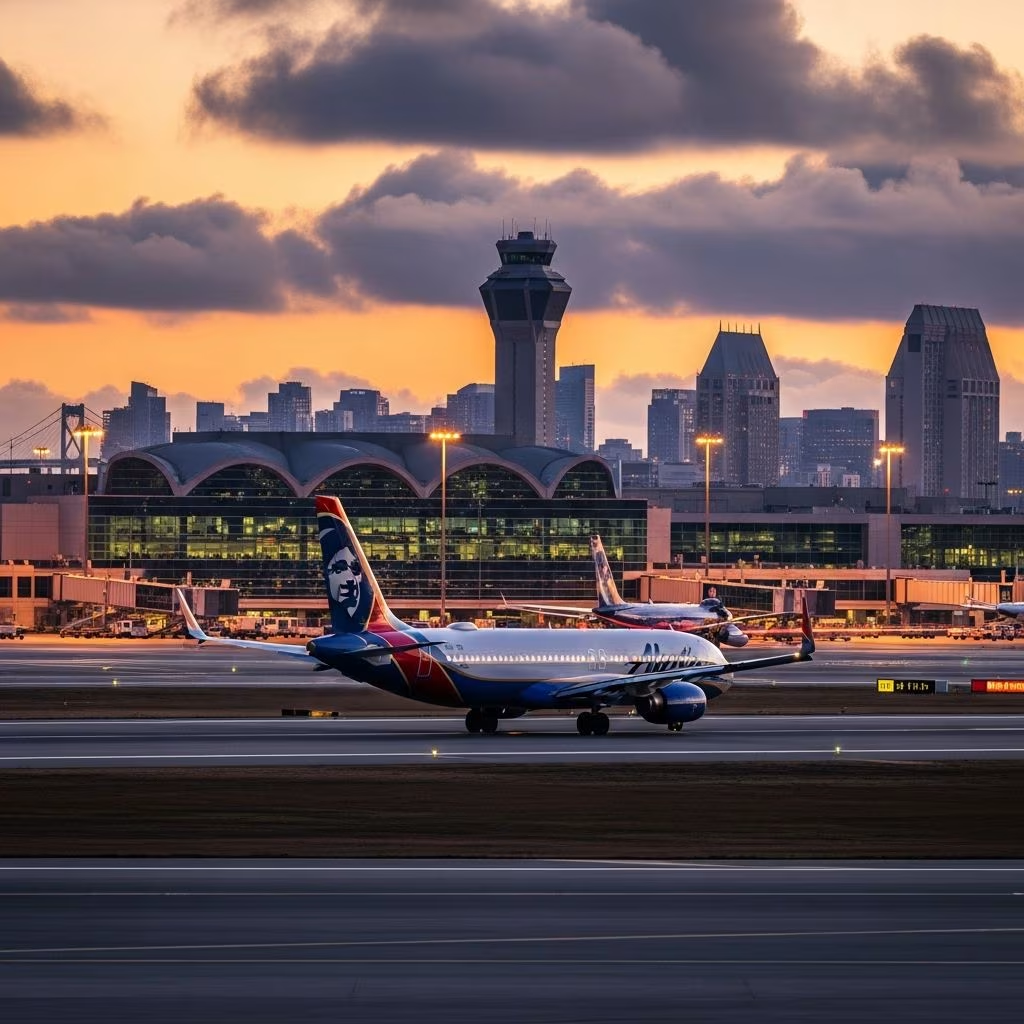
San Diego International Airport (SAN) stands out as the most expensive U.S. airport for domestic flights, with average airfares reaching $373.79.This positions it 22nd in overall cost rankings among the busiest 45 airports. Factors like limited infrastructure and high demand contribute to these elevated prices, even as the airport undergoes massive expansions.
The FinanceBuzz 2025 U.S. Airport Cost Rankings analyzed average domestic airfares from the 45 busiest U.S. airports, revealing stark differences in traveler expenses. Fort Lauderdale-Hollywood International (FLL) leads as the cheapest at $265.32, while Dulles (IAD) trails as the priciest at $490.14. SAN’s $373.79 average marks a $3.46 drop from the prior year, yet it remains among the upper tier of expensive hubs.
Geographically constrained between San Diego Bay and urban neighborhoods, SAN operates as the busiest single-runway airport in the nation, handling millions of passengers on just 663 acres. This limitation curbs flight capacity, driving up ticket prices through supply-demand dynamics.
| Cost Rank | Airport (Code) | State | Avg Airfare | Change vs. Prior Year |
|---|---|---|---|---|
| 1 (Cheapest) | Fort Lauderdale (FLL) | FL | $265.32 | -$5.36 |
| 22 | San Diego (SAN) | CA | $373.79 | -$3.46 |
| 30 | Seattle-Tacoma (SEA) | WA | $396.60 | +$5.14 |
| 44 | San Francisco (SFO) | CA | $452.89 | +$8.30 |
| 45 (Most Expensive) | Dulles (IAD) | DC | $490.14 | +$1.74 |
This table highlights SAN’s place relative to extremes and California peers, showing how West Coast airports generally command higher fares.
SAN’s recent transformation includes a groundbreaking $3.8 billion terminal project, replacing a 1960s-era structure with 30 state-of-the-art gates. Launched in 2021 at an estimated $2.6 billion, costs escalated to $3.4 billion by 2024 and beyond, surpassing initial projections amid inflation and supply chain issues.
Phase 1 of the new terminal opened on September 22, 2025, featuring elevated designs for flood resilience, seismic-resistant foundations, rainwater harvesting systems, and underground fuel infrastructure. Despite these advances, no additional runways were added, preserving SAN’s single-runway status and potential capacity bottlenecks.
These enhancements aim to handle growing traffic—SAN serves as a major hub for Alaska Airlines—without expanding the physical footprint.
Several intertwined factors keep SAN’s tickets pricey. Its prime location, just three miles from downtown, boosts demand from tourists, business travelers, and military personnel in the region. However, the single 9,400-foot runway limits simultaneous operations, leading to scheduling constraints and higher per-flight costs passed to passengers.
California’s broader market dynamics play a role too. Neighboring San Francisco (SFO) averages $452.89, and Oakland (OAK) is more affordable at $319.09, but SAN’s tourism draw—beaches, zoos, conventions—intensifies competition for seats.
Recent data shows a slight fare dip for SAN, unlike rises at SFO or Seattle-Tacoma (SEA). Yet, with passenger volumes ranking it 18th busiest, sustained demand pressures prices upward.
West Coast hubs dominate the higher end of rankings, reflecting tech hubs, entertainment draws, and limited land for expansion. Here’s a snapshot:
California’s five entries in the top 45 underscore regional pricing trends, where geography and popularity inflate costs.
While SAN’s prices sting, savvy strategies can help:
Monitoring year-over-year changes, like SAN’s recent decline, signals opportunities for deals.
With the new terminal operational, SAN eyes capacity boosts to 35 million annual passengers. Yet, without runway additions, congestion risks persist, especially with one runway vulnerable to weather or maintenance shutdowns.
U.S. trends show mixed fare movements: Minneapolis (MSP) jumped 11 ranks via a $26 drop, while San Antonio (SAT) plunged 10 spots on a $16 rise. Inflation, fuel prices, and airline consolidation will shape 2026 dynamics.
Federal data from the Bureau of Transportation Statistics corroborates these patterns, noting average domestic fares hovered around $350-400 in recent years, with coastal airports skewing higher.
Limited single-runway capacity, high tourism demand, and coastal location drive up fares to an average $373.79.
Not yet; the $3.8B upgrade improves efficiency but doesn’t add runways, so demand pressures remain.
Ontario (ONT) and John Wayne (SNA) offer lower fares, with easy drives to the city.
Tuesdays in shoulder seasons (spring/fall) yield the lowest rates.
Passenger volume ranks it 18th, busiest single-runway in the U.S.