
 Travel Essentials
 Travel Essentials

Explore the top U.S. cities battling severe traffic congestion, backed by recent data on hours lost, costs, and emerging solutions for smoother commutes.
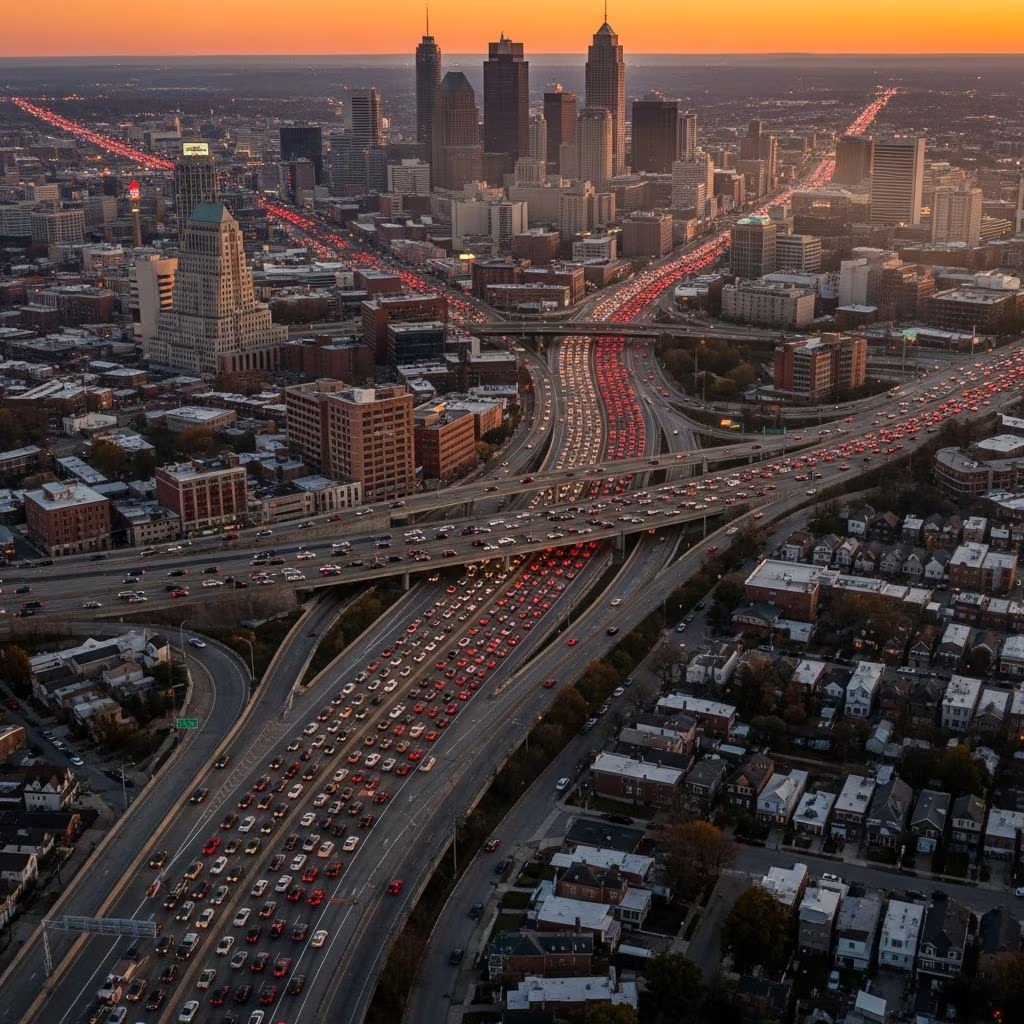 Travel Essentials
Traffic congestion remains a persistent challenge across American urban centers, costing drivers billions in lost time and productivity. Recent analyses reveal that U.S. cities lead global rankings for gridlock, with commuters enduring excessive hours stuck in jams annually. This article delves into the most affected metropolitan areas, underlying causes, economic repercussions, and forward-looking remedies.
Urban congestion arises from a mix of surging populations, inadequate infrastructure, and peak-hour travel patterns. In the U.S., drivers average 42 hours yearly in peak traffic, outpacing other developed nations. Factors like freight movement, construction, and events exacerbate delays, turning routine trips into marathons.
Based on comprehensive studies, these cities top the list for hours wasted in traffic. Los Angeles holds a notorious lead, while emerging data shows shifts like Washington, D.C., claiming the crown.
| Rank | City | Hours Lost Annually | Economic Cost per Driver |
|---|---|---|---|
| 1 | Los Angeles, CA | 104 | $2,408 |
| 2 | Washington, D.C. | ~100 | $1,800+ |
| 3 | New York, NY | 91 | $2,000+ |
| 4 | San Francisco, CA | 78 | $1,900 |
| 5 | Atlanta, GA | 70 | $1,500 |
| 6 | Miami, FL | 65 | $1,400 |
| 7 | Boston, MA | 62 | $1,600 |
| 8 | Seattle, WA | 60 | $1,700 |
| 9 | Houston, TX | 58 | $1,300 |
| 10 | Chicago, IL | 55 | $1,500 |
Note: Figures draw from INRIX and TomTom metrics, adjusted for recent trends. Local variations occur due to events and seasons.
Los Angeles drivers lose 104 hours yearly to jams, the highest globally, fueling a $9.6 billion citywide tab. Sprawling layout, port traffic, and entertainment hubs create nonstop chokepoints on freeways like the I-405.
A typical 10-mile trip balloons to 45 minutes during rush hour. Freight from ports adds 20% to delays, while hillside fires and events compound issues.
Overpassing Los Angeles, D.C. now ranks worst, with federal workers, tourists, and beltway snarls driving 100+ hours lost per driver. The Capital Beltway (I-495) epitomizes chaos.
Nationwide, congestion drains $300 billion yearly, or $1,400 per driver, through fuel waste, tardiness, and health strains. Major cities face $2.5 billion+ hits each.
| City | Total Annual Cost | Impact Areas |
|---|---|---|
| Los Angeles | $9.6B | Fuel, productivity, healthcare |
| New York | $5B+ | Business losses, emissions |
| San Francisco | $4B | Tech sector delays |
Coastal hubs like LA and NYC draw millions, overwhelming radial highways. Inland growth in Atlanta mirrors suburban sprawl issues.
Ports in LA, NY, and Miami handle massive cargo, spilling onto public roads during peaks.
Individuals and cities combat congestion through innovation.
Los Angeles invests in express lanes and rail extensions. D.C. promotes HOV lanes and smart signals. Atlanta trials congestion pricing.
Autonomous vehicles and AI traffic management promise relief. TomTom data shows planning tools reducing delays by 15%. Federal funds target resilient infrastructure.
Washington, D.C. edges out Los Angeles, per latest ConsumerAffairs and INRIX rankings.
Average of 42 hours nationally, soaring to 104 in LA.
Peak commutes, population booms, and freight dominate.
Yes, micromobility grows rapidly, and smart tech optimizes flows.
Nearly $300 billion annually.
Check apps like Waze or INRIX for real-time insights. Opt for off-peak travel and alternatives to driving. Urban mobility evolves—stay ahead.