
 Travel Essentials
 Travel Essentials

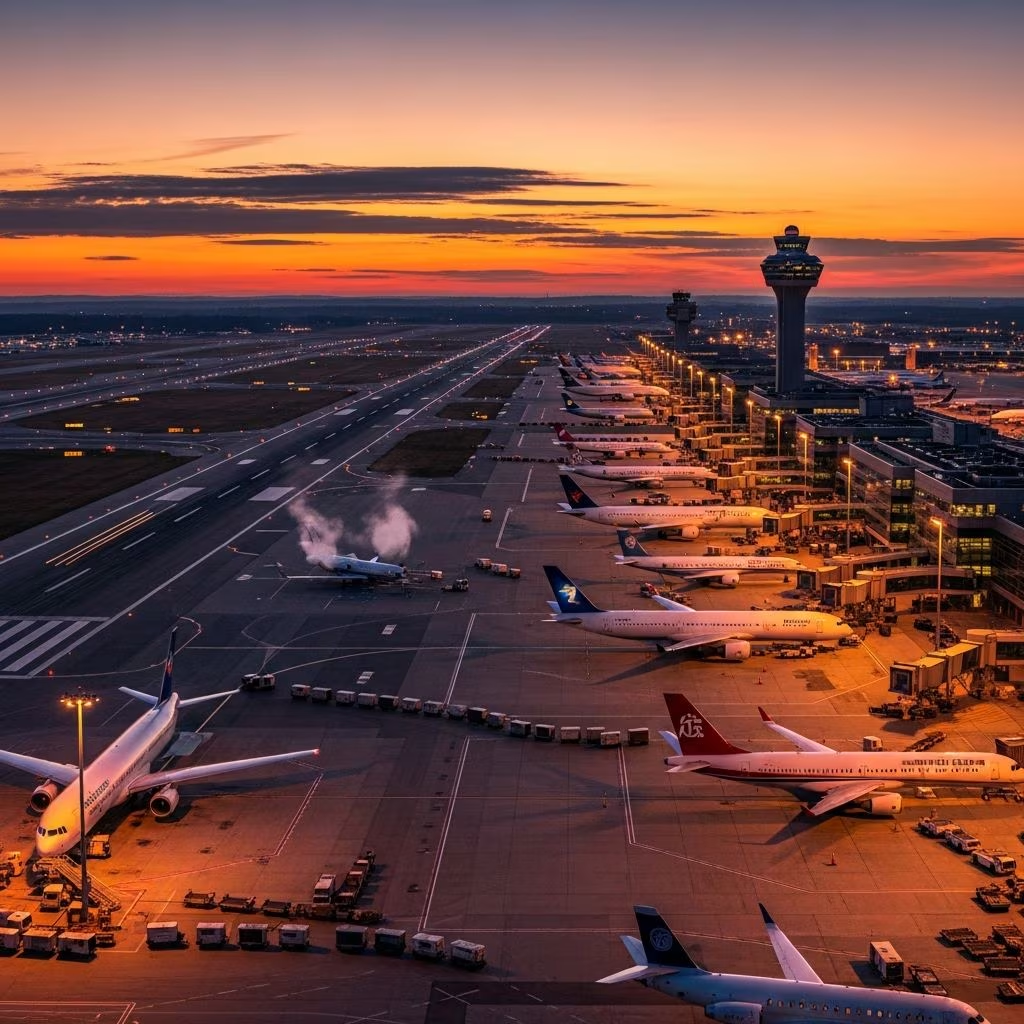
Ranking of US airports with highest flight delays based on recent data, including causes like weather and traffic, plus tips for smoother travel.
 Travel Essentials
Flight delays affect millions of travelers annually, turning routine trips into stressful ordeals. Recent analyses reveal persistent patterns at major US hubs, where factors like congestion, weather, and infrastructure strain lead to high disruption rates. This article ranks the worst offenders, highlights reliable alternatives, and offers practical advice for navigating air travel challenges.
Air traffic has rebounded strongly post-pandemic, pushing airports to their limits. Data from the Bureau of Transportation Statistics (BTS) shows that in 2025, average on-time arrival rates hovered around 75-80% at busy hubs, but some locations lagged far behind. Delays are defined as arrivals or departures more than 15 minutes late, with cascading effects rippling through networks.
Regional variations play a big role. East Coast airports often battle winter storms and dense airspace, while Florida hubs grapple with thunderstorms and tourism surges. Western states fare better due to favorable weather and expansions, but no airport is immune.
Compiling data from multiple 2025 reports, Chicago O’Hare tops the list with nearly 28% of flights delayed, followed closely by Denver and Miami. These rankings reflect departure delays primarily, as they best predict traveler experiences.
| Rank | Airport (Code) | City/State | % Delayed (2025 Avg) |
|---|---|---|---|
| 1 | Chicago O’Hare (ORD) | Chicago, IL | 28% |
| 2 | Denver International (DEN) | Denver, CO | 27% |
| 3 | Miami International (MIA) | Miami, FL | 26% |
| 4 | Newark Liberty (EWR) | Newark, NJ | 26% |
| 5 | LaGuardia (LGA) | New York, NY | 26% |
| 6 | Philadelphia Intl (PHL) | Philadelphia, PA | 26% |
| 7 | Reagan National (DCA) | Washington, DC | 26% (67% on-time) |
| 8 | JFK International (JFK) | New York, NY | 25% |
| 9 | Orlando Intl (MCO) | Orlando, FL | 25% |
| 10 | Dulles Intl (IAD) | Washington, DC | 25% |
These figures stem from BTS and FAA reports, emphasizing major airports handling over 1% of national traffic. Newark and DCA also see high cancellation rates, amplifying misery for passengers.
Smaller airports like Orlando Sanford (32% disrupted) punch above their weight, driven by leisure charters sensitive to minor disruptions.
Florida leads with multiple problematic airports, where leisure traffic overwhelms facilities. New Jersey’s EWR drags its average, while Virginia and Kansas tie for high disruption shares around 24%.
| Rank | State | % Delayed or Canceled | Key Airports |
|---|---|---|---|
| 1 | Florida | 25-32% | SFB, PIE, PBI, MCO |
| 2 | New Jersey | 26.4% | EWR |
| 3 | Virginia/DC | 23.8-26% | DCA, IAD, ROA |
| 4 | Kansas | 23.8% | Regional hubs |
| 5 | West Virginia | High regional | Small fields |
In contrast, Hawaii, Utah, and Arizona boast low rates under 20%, thanks to expansions and climates.
Not all news is grim. Salt Lake City (SLC) achieved 84% on-time arrivals in early 2025, leveraging recent renovations and Delta’s hub efficiency. Others shine similarly:
These airports invest in technology like better radar and automated gates, minimizing ground holds.
Delays cost passengers time and money. Travel insurance claims average $500-750 per incident in high-delay states like New Jersey ($751) and Arkansas ($733). Meals, hotels, and missed connections add up, with total US delay costs exceeding $40 billion yearly per FAA estimates.
Smart planning beats bad luck:
International travelers note similar woes abroad, with Toronto and Frankfurt mirroring US patterns.
FAA’s NextGen upgrades promise better flow control by 2030, while billions in infrastructure funding target ORD, LGA, and PHL. Airlines are adding crew bases, but demand growth may outpace fixes. Travelers should stay vigilant.
Primarily air traffic congestion (35%), weather (25%), and airline issues (20%), per BTS data.
Chicago O’Hare (ORD) had 28% delays in 2025; consider Midway for Chicago trips.
Often yes, but exceptions like Sanford (32% disrupted) exist due to charters.
DOT rules mandate refunds for 3+ hour domestic delays; insurance helps elsewhere.
Partially—SLC’s upgrades boosted performance, but traffic growth challenges persist.