
 Travel Essentials
 Travel Essentials

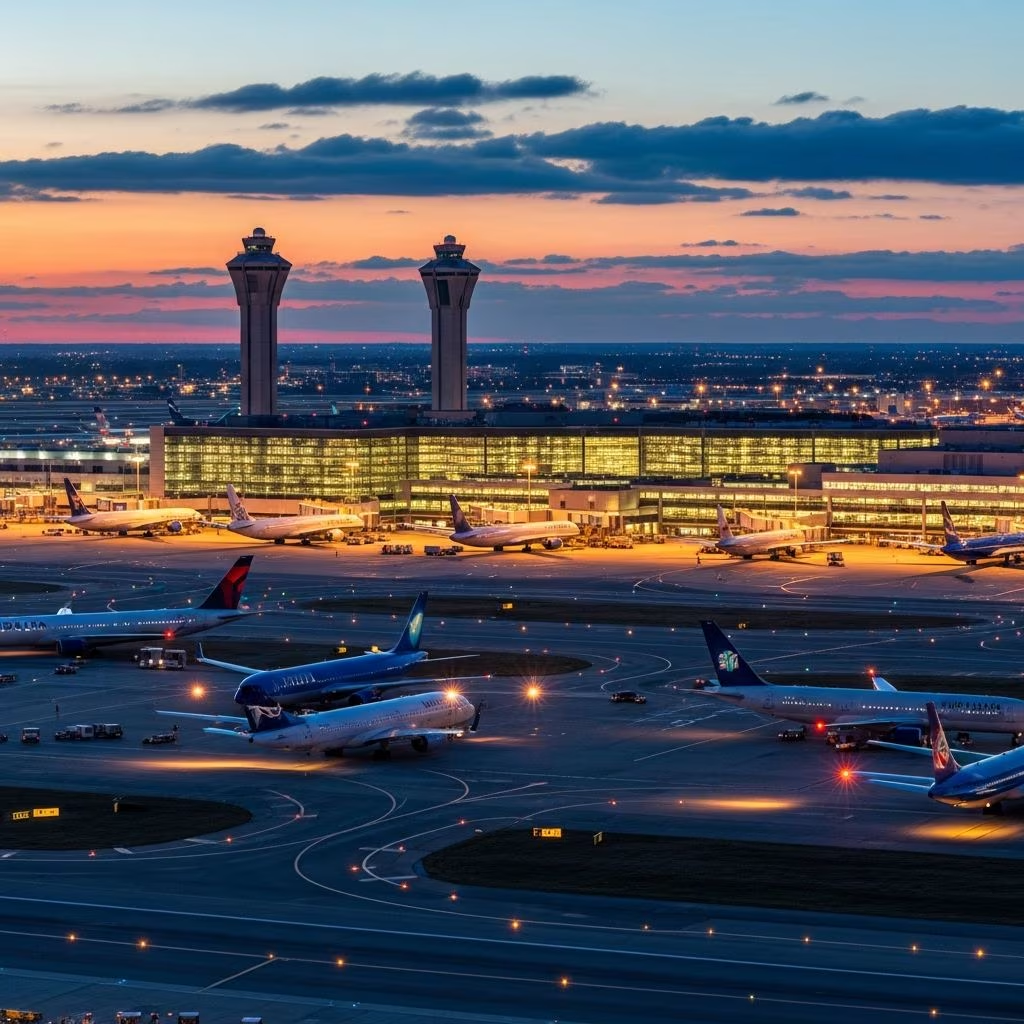
Ranking of US airports with the most flight delays based on recent data, including causes, tips for travelers, and top performers for smoother journeys.
 Travel Essentials
Flight delays remain a persistent challenge for air travelers across the United States, impacting millions annually and leading to frustration, missed connections, and added costs. Recent analyses from aviation reports reveal consistent patterns at major hubs, where environmental factors, air traffic congestion, and operational bottlenecks play significant roles. Understanding these trends empowers passengers to make informed choices when booking flights.
Several elements contribute to elevated delay rates at busy US airports. Weather conditions, such as winter storms in the Northeast or thunderstorms in the South, frequently disrupt schedules. High passenger volumes exacerbate issues, with airports like those in New York and Chicago handling disproportionate traffic. Air traffic control limitations and airline scheduling practices also factor in, as denser flight banks strain runway capacities.
According to US Department of Transportation metrics, delays are defined as flights arriving or departing 15 minutes or more past schedule, providing a standardized measure across reports.
Compiling data from multiple 2025 analyses, certain airports repeatedly top lists for poor on-time performance. Chicago O’Hare leads with 28% of flights delayed, followed closely by Denver at 27%. These figures reflect percentages of departures or arrivals affected, highlighting systemic issues at high-volume sites.
| Rank | Airport (Code) | Delay Rate (%) | Primary Reasons |
|---|---|---|---|
| 1 | Chicago O’Hare (ORD) | 28 | Weather, congestion |
| 2 | Denver Intl (DEN) | 27 | High altitude, storms |
| 3 | Miami Intl (MIA) | 26 | Thunderstorms, traffic |
| 4 | Newark Liberty (EWR) | 26 (delays + 2.7% cancels) | East Coast weather, volume |
| 5 | LaGuardia (LGA) | 26 | Urban congestion, slots |
| 6 | Philadelphia (PHL) | 26 / 73.6 on-time | Northeast winter |
| 7 | Reagan National (DCA) | 26 / 67.2 on-time | Restricted airspace |
| 8 | JFK Intl (JFK) | 25 | International traffic |
| 9 | Orlando Intl (MCO) | 25 / 24 historically | Tourism peaks |
| 10 | Dulles Intl (IAD) | 25 | Long-haul routes |
This table aggregates findings from 2025 reports, showing overlap in problematic hubs. Note variations by metric—some focus on arrivals, others departures—but patterns persist.
Delays cluster geographically. East Coast airports like Newark, LaGuardia, JFK, and Philadelphia suffer from dense airspace and seasonal weather. Florida sites (Miami, Orlando, Fort Lauderdale) face summer hurricanes and winter tourist rushes. Midwest challengers like Chicago O’Hare grapple with lake-effect snow, while Denver’s mountainous terrain adds wind shear risks.
Western airports fare better overall, though Las Vegas and Seattle appear in older high-delay lists due to slot constraints and marine layer fog.
Not all hubs falter; several excel in punctuality. Salt Lake City International boasts 84.4% on-time arrivals in early 2025, thanks to expansion projects and favorable weather. Others like Los Angeles, Phoenix, and Minneapolis benefit from modern infrastructure and lower density.
| Rank | Airport (Code) | On-Time Rate (%) |
|---|---|---|
| 1 | Salt Lake City (SLC) | 84.4 / 82 |
| 2 | Los Angeles (LAX) | 81.7 / 80 |
| 3 | Phoenix Sky Harbor (PHX) | 81.2 / 78 |
| 4 | Minneapolis-St. Paul (MSP) | 80.8 / 78 |
| 5 | Detroit Metro (DTW) | 79.6 / 77 |
| 6 | Honolulu (HNL) | 84 on-time departures |
| 7 | San Francisco (SFO) | 79 |
These performers offer alternatives for connections, with SLC and HNL particularly noted for trans-Pacific reliability.
Route-specific data uncovers additional risks. Chicago O’Hare to Frankfurt sees 46% delays, likely from transatlantic weather crossings. Dulles-Frankfurt (43%) and Miami-São Paulo (40%) follow, blending US hub issues with international variables. Domestic pain points include Newark routes and Florida corridors.
Proactive planning mitigates risks. Opt for early morning or midday flights, as airlines front-load schedules. Choose airlines with strong records at specific airports—Delta at Atlanta, Southwest at Midway (despite its 47% historical rate).
Passenger volumes hit 2.4 million daily screenings by late 2025, up 9% from pre-pandemic, straining systems further.
Federal investments via the Infrastructure Act fund runway expansions and ATC modernization, promising relief. Airports like DEN and ORD undergo major upgrades. However, climate change may intensify weather disruptions, necessitating adaptive strategies.
Global comparisons show US hubs middling; Toronto (52%) and European sites like Frankfurt (45%) fare worse, per older data.
Weather tops the list, followed by air traffic volume and airline operations.
Newark (EWR) and Chicago O’Hare (ORD) have high cancellation risks alongside delays.
Q2 2025 saw 25% off-schedule domestic flights, worst since 2014, indicating ongoing challenges.
DOT rules mandate refunds for delays over 3 hours (domestic); check airline policies.
Early mornings (6-9 AM) or late evenings show highest on-time rates across hubs.
In summary, while delays persist at key US airports, data-driven choices and preparation enhance travel experiences. Stay informed via official sources for the latest metrics.